Pandas is a library that is useful for working with different types of datasets. A dataframe is a pandas object that has a variety of function to analyze and visualize data. It arranges the data in rows and columns. There are multiple ways in which a dataframe can be created. For example, a dictionary can be converted to a datafraem such that the keys become headers and values (list) are entries in the dataframe. The orientation of the dataframe by default is columns ie keys are considered as column header and values are rows. This behaviour can be changed using the orient argument. When orientation is index, an addtional argument columns can be used to specify column headers.
= {'Column1' : ['A' ,'B' ,'C' ,'D' ,'E' ], \ 'Column2' :[1 ,2 ,3 ,4 ,5 ]}= pd.DataFrame.from_dict(input_dict)= pd.DataFrame.from_dict(input_dict, orient= 'index' , columns= ['Val1' ,'Val2' ,'Val3' ,'Val4' ,'Val5' ,])
Column1
Column2
0
A
1
1
B
2
2
C
3
3
D
4
4
E
5
Val1
Val2
Val3
Val4
Val5
Column1
A
B
C
D
E
Column2
1
2
3
4
5
Index(['Column1', 'Column2'], dtype='object')
Reading data from a csv file
The read_csv() function can be used to create a dataframe from a csv file. To use one of the columns as indices for the dataframe add the index_col keyword attribute.
# %load test.csv 22 ,India21 ,USA
= pd.read_csv("test.csv" )= pd.read_csv("test.csv" , index_col= "Country" )
Name
Age
Country
0
Sohan
22
India
1
Sam
21
USA
Name
Age
Country
India
Sohan
22
USA
Sam
21
Combining dataframes - join, merge, and concat
Concat is used to combine dataframes across rows or columns. Merge is used to combine dataframes on common columns or indices. Join is used to combine based on a key column or index.
import numpy as np= pd.DataFrame(np.random.uniform(1 ,2 ,size= (5 , 4 )), columns= list ('ABCD' ))= pd.DataFrame(np.random.uniform(2 ,3 ,size= (5 , 4 )), columns= list ('ABCD' ))
A
B
C
D
0
1.356623
1.477763
1.569974
1.778819
1
1.532714
1.464930
1.382634
1.496065
2
1.565586
1.537660
1.558265
1.089754
3
1.526300
1.392927
1.798358
1.181237
4
1.693383
1.225141
1.411091
1.804210
A
B
C
D
0
2.246880
2.632981
2.831306
2.088775
1
2.990886
2.369731
2.697256
2.048426
2
2.030963
2.141273
2.001073
2.406086
3
2.295191
2.721775
2.267560
2.300182
4
2.182948
2.941006
2.654403
2.478437
= pd.concat([df_1,df_2],ignore_index= True )
A
B
C
D
0
1.356623
1.477763
1.569974
1.778819
1
1.532714
1.464930
1.382634
1.496065
2
1.565586
1.537660
1.558265
1.089754
3
1.526300
1.392927
1.798358
1.181237
4
1.693383
1.225141
1.411091
1.804210
5
2.246880
2.632981
2.831306
2.088775
6
2.990886
2.369731
2.697256
2.048426
7
2.030963
2.141273
2.001073
2.406086
8
2.295191
2.721775
2.267560
2.300182
9
2.182948
2.941006
2.654403
2.478437
= pd.concat([df_1,df_2],axis= 1 )
A
B
C
D
A
B
C
D
0
1.356623
1.477763
1.569974
1.778819
2.246880
2.632981
2.831306
2.088775
1
1.532714
1.464930
1.382634
1.496065
2.990886
2.369731
2.697256
2.048426
2
1.565586
1.537660
1.558265
1.089754
2.030963
2.141273
2.001073
2.406086
3
1.526300
1.392927
1.798358
1.181237
2.295191
2.721775
2.267560
2.300182
4
1.693383
1.225141
1.411091
1.804210
2.182948
2.941006
2.654403
2.478437
= pd.concat([df_1,df_2],keys= ["First" ,"Second" ])
A
B
C
D
First
0
1.356623
1.477763
1.569974
1.778819
1
1.532714
1.464930
1.382634
1.496065
2
1.565586
1.537660
1.558265
1.089754
3
1.526300
1.392927
1.798358
1.181237
4
1.693383
1.225141
1.411091
1.804210
Second
0
2.246880
2.632981
2.831306
2.088775
1
2.990886
2.369731
2.697256
2.048426
2
2.030963
2.141273
2.001073
2.406086
3
2.295191
2.721775
2.267560
2.300182
4
2.182948
2.941006
2.654403
2.478437
"First" ])
A
B
C
D
0
1.356623
1.477763
1.569974
1.778819
1
1.532714
1.464930
1.382634
1.496065
2
1.565586
1.537660
1.558265
1.089754
3
1.526300
1.392927
1.798358
1.181237
4
1.693383
1.225141
1.411091
1.804210
Merge is used combine dataframe on one or more columns
= pd.read_csv("test.csv" )= df3.copy(deep= True )2 ]= ["Peter" , 20 , "UK" ] len (df4.index)] = ["Mohan" , 25 , "India" ]= pd.merge(df3,df4)= pd.merge(df3,df4,on= ["Country" ,"Name" ],\ = ('_df3' , '_df4' ))
df3
Name
Age
Country
0
Sohan
22
India
1
Sam
21
USA
df4
Name
Age
Country
0
Sohan
22
India
1
Sam
21
USA
2
Peter
20
UK
3
Mohan
25
India
df_merged1
Name
Age
Country
0
Sohan
22
India
1
Sam
21
USA
df_merged2
Name
Age_df3
Country
Age_df4
0
Sohan
22
India
22
1
Sam
21
USA
21
Join is used to combine dataframes along a specific column.
= '_df3' , rsuffix= '_df4' ))
Name_df3
Age_df3
Country_df3
Name_df4
Age_df4
Country_df4
0
Sohan
22
India
Sohan
22
India
1
Sam
21
USA
Sam
21
USA
Name
Age
Country
0
Sohan
22
India
1
Sam
21
USA
"Country" ),on= "Country" , lsuffix= '_df3' , rsuffix= '_df4' ))
Name_df3
Age_df3
Country
Name_df4
Age_df4
0
Sohan
22
India
Sohan
22
0
Sohan
22
India
Mohan
25
1
Sam
21
USA
Sam
21
"Country" ),on= "Country" , lsuffix= '_df3' , rsuffix= '_df4' , how= "outer" ))
Name_df3
Age_df3
Country
Name_df4
Age_df4
0.0
Sohan
22.0
India
Sohan
22
0.0
Sohan
22.0
India
Mohan
25
1.0
Sam
21.0
USA
Sam
21
NaN
NaN
NaN
UK
Peter
20
Groupby
We can create groups for same values in a column to apply a function to all rows having a particular value.
= [["Sam" ,"Peter" ,"Mohan" , "Mike" ], ["UG" ,"PG" ,"UG" ,"PG" ], [70 ,80 ,90 ,70 ]]= pd.DataFrame(students).T= ["Name" ,"Program" ,"Marks" ]
Name
Program
Marks
0
Sam
UG
70
1
Peter
PG
80
2
Mohan
UG
90
3
Mike
PG
70
"Program" , inplace= True )
Name
Marks
Program
UG
Sam
70
PG
Peter
80
UG
Mohan
90
PG
Mike
70
= "Program" )["Marks" ].mean()
Program
PG    75.0
UG    80.0
Name: Marks, dtype: float64
Ploting
Dataframe has a plot() function to do basic visualization. The kind attribute for this function can be used to change the plot type.
= pd.DataFrame(np.array(range (1 ,6 ))** 2 )= pd.DataFrame(np.array(range (1 ,6 ))** 3 )= pd.concat([df_col1,df_col2], axis= 1 , ignore_index= True )= ["Squares" , "Cubes" ]= range (1 ,6 )
Squares
Cubes
1
1
1
2
4
8
3
9
27
4
16
64
5
25
125
= df_comb.plot(title= "Line Plot" )= df_comb.plot(kind= "bar" , title= "Bar Plot" )
The iris dataset
= 'https://archive.ics.uci.edu/ml/machine-learning-databases/iris/iris.data' # using the attribute information as the column names = ['Sepal_Length' ,'Sepal_Width' ,'Petal_Length' ,'Petal_Width' ,'Class' ]= pd.read_csv(csv_url, names = col_names)
Sepal_Length
Sepal_Width
Petal_Length
Petal_Width
Class
0
5.1
3.5
1.4
0.2
Iris-setosa
1
4.9
3.0
1.4
0.2
Iris-setosa
2
4.7
3.2
1.3
0.2
Iris-setosa
3
4.6
3.1
1.5
0.2
Iris-setosa
4
5.0
3.6
1.4
0.2
Iris-setosa
...
...
...
...
...
...
145
6.7
3.0
5.2
2.3
Iris-virginica
146
6.3
2.5
5.0
1.9
Iris-virginica
147
6.5
3.0
5.2
2.0
Iris-virginica
148
6.2
3.4
5.4
2.3
Iris-virginica
149
5.9
3.0
5.1
1.8
Iris-virginica
150 rows × 5 columns
print ("Shape" , iris.shape)print (iris.dtypes)
Shape (150, 5)
Sepal_Length    float64
Sepal_Width     float64
Petal_Length    float64
Petal_Width     float64
Class            object
dtype: object
Sepal_Length
Sepal_Width
Petal_Length
Petal_Width
count
150.000000
150.000000
150.000000
150.000000
mean
5.843333
3.054000
3.758667
1.198667
std
0.828066
0.433594
1.764420
0.763161
min
4.300000
2.000000
1.000000
0.100000
25%
5.100000
2.800000
1.600000
0.300000
50%
5.800000
3.000000
4.350000
1.300000
75%
6.400000
3.300000
5.100000
1.800000
max
7.900000
4.400000
6.900000
2.500000
"Class" ).groupby(level= "Class" ).describe()
Sepal_Length
Sepal_Width
...
Petal_Length
Petal_Width
count
mean
std
min
25%
50%
75%
max
count
mean
...
75%
max
count
mean
std
min
25%
50%
75%
max
Class
Iris-setosa
50.0
5.006
0.352490
4.3
4.800
5.0
5.2
5.8
50.0
3.418
...
1.575
1.9
50.0
0.244
0.107210
0.1
0.2
0.2
0.3
0.6
Iris-versicolor
50.0
5.936
0.516171
4.9
5.600
5.9
6.3
7.0
50.0
2.770
...
4.600
5.1
50.0
1.326
0.197753
1.0
1.2
1.3
1.5
1.8
Iris-virginica
50.0
6.588
0.635880
4.9
6.225
6.5
6.9
7.9
50.0
2.974
...
5.875
6.9
50.0
2.026
0.274650
1.4
1.8
2.0
2.3
2.5
3 rows × 32 columns
= iris.plot.scatter(x= "Sepal_Length" ,y= "Sepal_Width" )
import matplotlib.pyplot as pltimport seaborn as sns
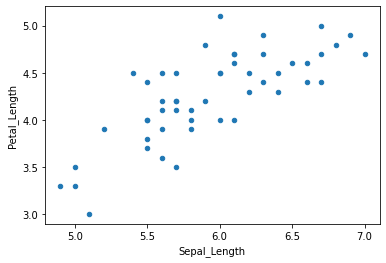
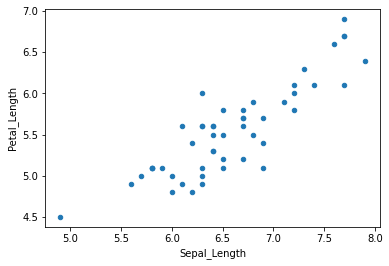
= iris.set_index("Class" ).groupby(level= "Class" ).plot.scatter(x= "Sepal_Length" ,y= "Petal_Length" )
= sns.jointplot(data= iris,x= "Sepal_Length" ,y= "Petal_Length" ,hue= "Class" )


